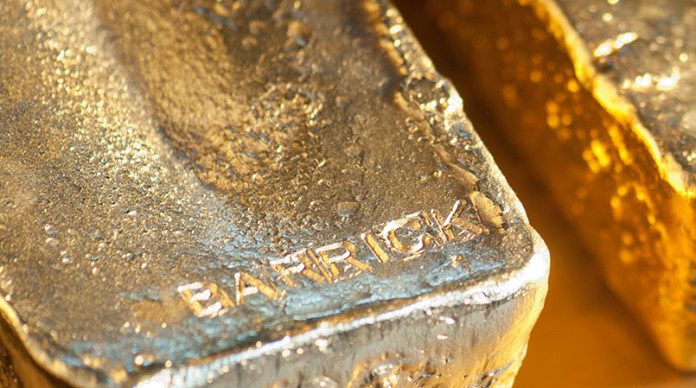
IT has been nearly five years now since the peak in the gold price at over $1,900 per ounce, which was followed by a precipitous decline to a low of $1,100 at the end of 2015. For most of the large gold mining companies, this ushered in a period of repairing balance sheets. But as the gold price now strengthens in an uncertain political and economic world, what follows for the gold companies?
For the peer group1 equivalent2 gold production was rising at just under 5% per annum from the beginning of 2009, peaking in the fourth quarter of 2013. Debt was largely the financing agent for the expansion plans that nearly every senior gold mining company was embarking upon.
Net debt3 peaked at $32.1bn in the second quarter of 2013. However, the average gold price received by mining companies peaked in the fourth quarter of 2012, and fell by $300 per ounce within six months. The market capitalisation for the sector did not wait – it fell far quicker and further, in fact by half within nine months. Almost overnight, financial liquidity became paramount.
Our preferred measurement of financial liquidity is the ratio of net debt to EBITDA4, less sustaining capital. Our modified ratio peaked at 4.4 in the second quarter of 2013, at a level which should have demanded more attention from bankers, bond holders and equity holders. It certainly galvanised a new sweep of C-suite managers and strategies changed quickly to balance sheet repair and cash flow.
This has been the dominant strategy for the last four years.
So, how successful has the peer group been and is it now time to switch course? From its peak in the fourth quarter of 2013, equivalent gold production for our peer group has fallen by 10%. Arguably, this is a reasonably impressive result and shows the “inventory” effect that all senior gold mining companies enjoy.
But without investment, the inventory does become depleted. Total capital expenditure for this peer group peaked at $6.3bn per quarter at the end of 2012. By the beginning of 2016, this figure had dropped to just $1.6bn. Project capital expenditure, not surprisingly, took the brunt of the cuts, but also sustaining capital expenditure, corporate costs and expensed exploration.
We think some companies have over-cut capital savings, making the companies appear, to some extent, more robust cash generators than they are. Total capital expenditure is now rising again, and has reached a level of $2.2bn per quarter. But this is still well below a level, in our view, that is required to sustain production.
Costs have also been reduced during this period of austerity, albeit quite modestly. Cash costs (before any capital spend) have fallen by 12% from their peak at the beginning of 2013, small when compared to a corresponding 53% drop in the price of oil.
What should happen now? Certainly, net debt has been curtailed to more comfortable levels. Using our preferred financial metric, the ratio of net debt to EBITDA, less sustaining capital is now only 1.5 times, albeit at a time of globally low interest rates. Cash costs are rising again, up 4% from their low point, but at a slow pace.
However, the real issue facing the companies and investors is capital – how much needs to be spent to maintain a sustainable business model? Inventories are running ever lower, not yet critical, but nonetheless lower. The reserve life for this peer group peaked at 27 years at the start of 2013. It now stands at 18 years, some 33% lower in the space of just four years.
There are two reasons given typically to invest in gold shares; the gearing affect (a 10% increase in the gold price can result in a 20% increase in earnings, assuming all other metrics remain constant) and dividends.
Right now, as we look at the sector, meaningful dividends still look quite far away. Reinvesting in the production portfolio will have to take preference, in effect reducing that gearing affect, by lifting the real cost of production to shareholders.
In conclusion, not all companies in the peer group we analyse are the same, bespoke analysis is always required. But for the peer group that make up our quarterly reporting service, the challenge will be to return to a sustainable business model at a reasonable cost. Investors need to understand this reality.
1 The Gold Peer Group Analysis is a subscriber-only service, updated each quarter. The Peer Group covers: Agnico Eagle Mines, AngloGold Ashanti, Barrick Gold, Gold Fields, Harmony Gold, Kinross Gold, Newcrest Mining, Newmont Mining, Polymetal, Randgold Resources and Sibanye Gold.
2Equivalent gold production is gold production plus by-product production converted by value to equivalent gold production.
3Net debt is gross interest-bearing debt less cash and cash equivalents.
4EBITDA is earnings before interest, tax, depreciation and amortisation.
Michael Bedford CFA ACSM is a consultant to Metals Focus and CEO of a UK-based fund management company. He worked for over 20 years as a mining analyst before joining Anglogold Ashanti to work on company strategy and business planning.


